UX Case Study — Supply Chain Dashboard
01 / Overview
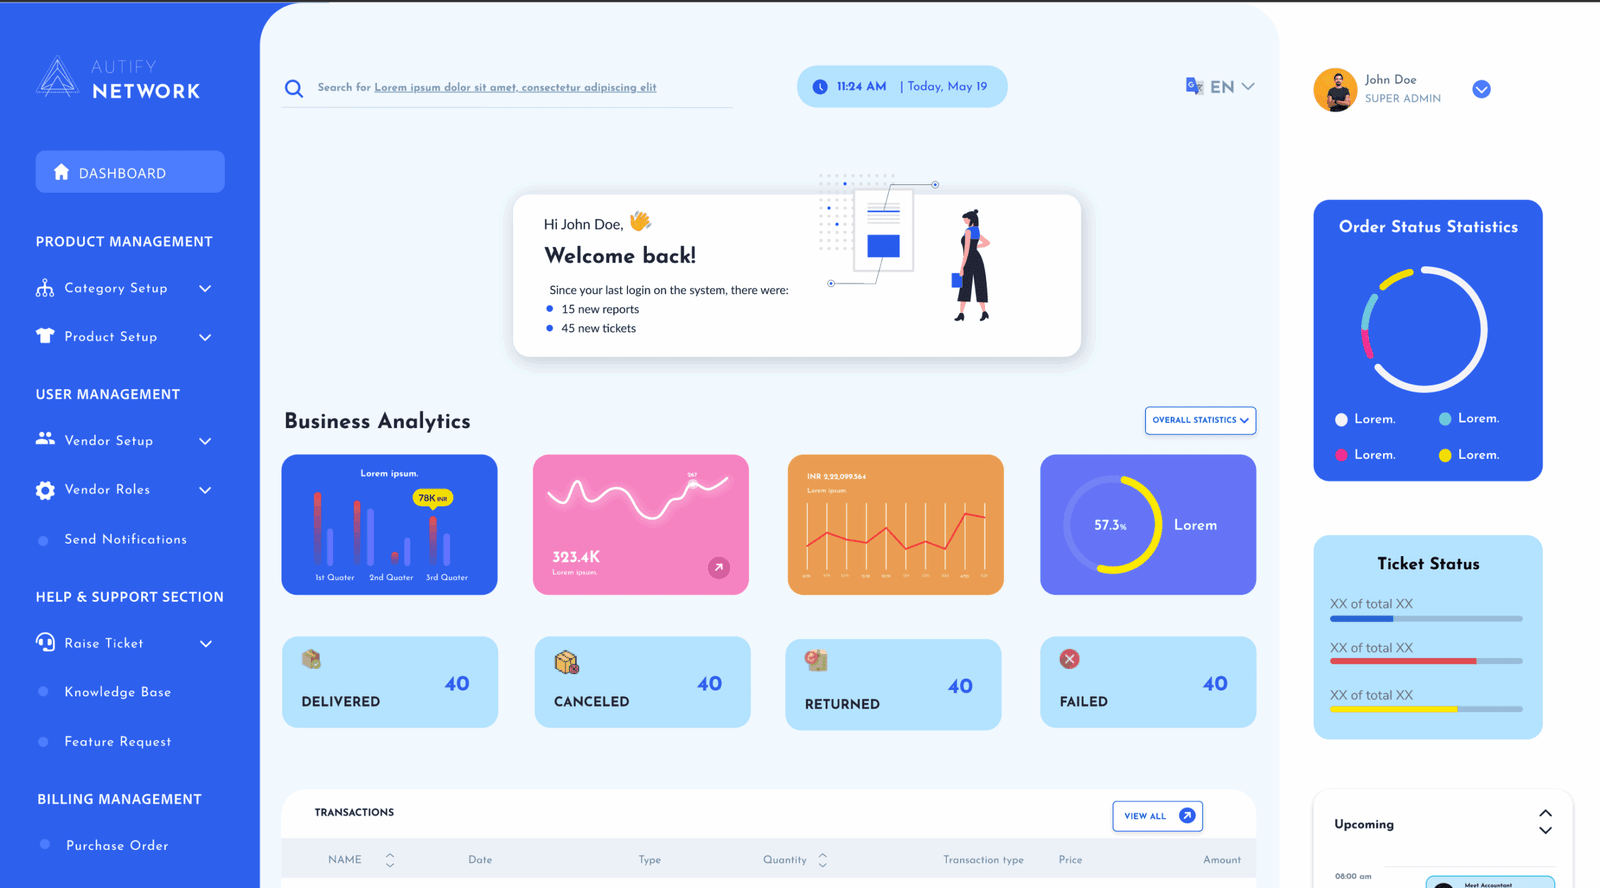
Supply chains run the world — but too often, they're still run on paper. I designed a Supply Chain Management Dashboard for a SaaS product that digitizes and automates the daily grind of supply chain operations — from vendor management to purchase orders, product catalogs, and beyond.
Product Type:
Supply Chain SaaS
My Role
Product Designer
Platform
Web App
Tools Used
Adobe XD
02 / The Problem
Most small-to-mid supply chain teams still rely on spreadsheets, paperwork, and siloed communication. This causes:Their pain points?
Delayed vendor coordination Lost or untracked purchase orders Fragmented billing records Zero visibility into what’s happening on the ground The opportunity?Replace chaos with a single digital command center.
03 / UX Goals
- Design a clean, intuitive dashboard for day-to-day supply chain operations - Centralize documents, vendors, categories, and products - Streamline billing & purchase order (PO) workflows - Enable real-time tracking across every operational step
04 / Key Features Designed
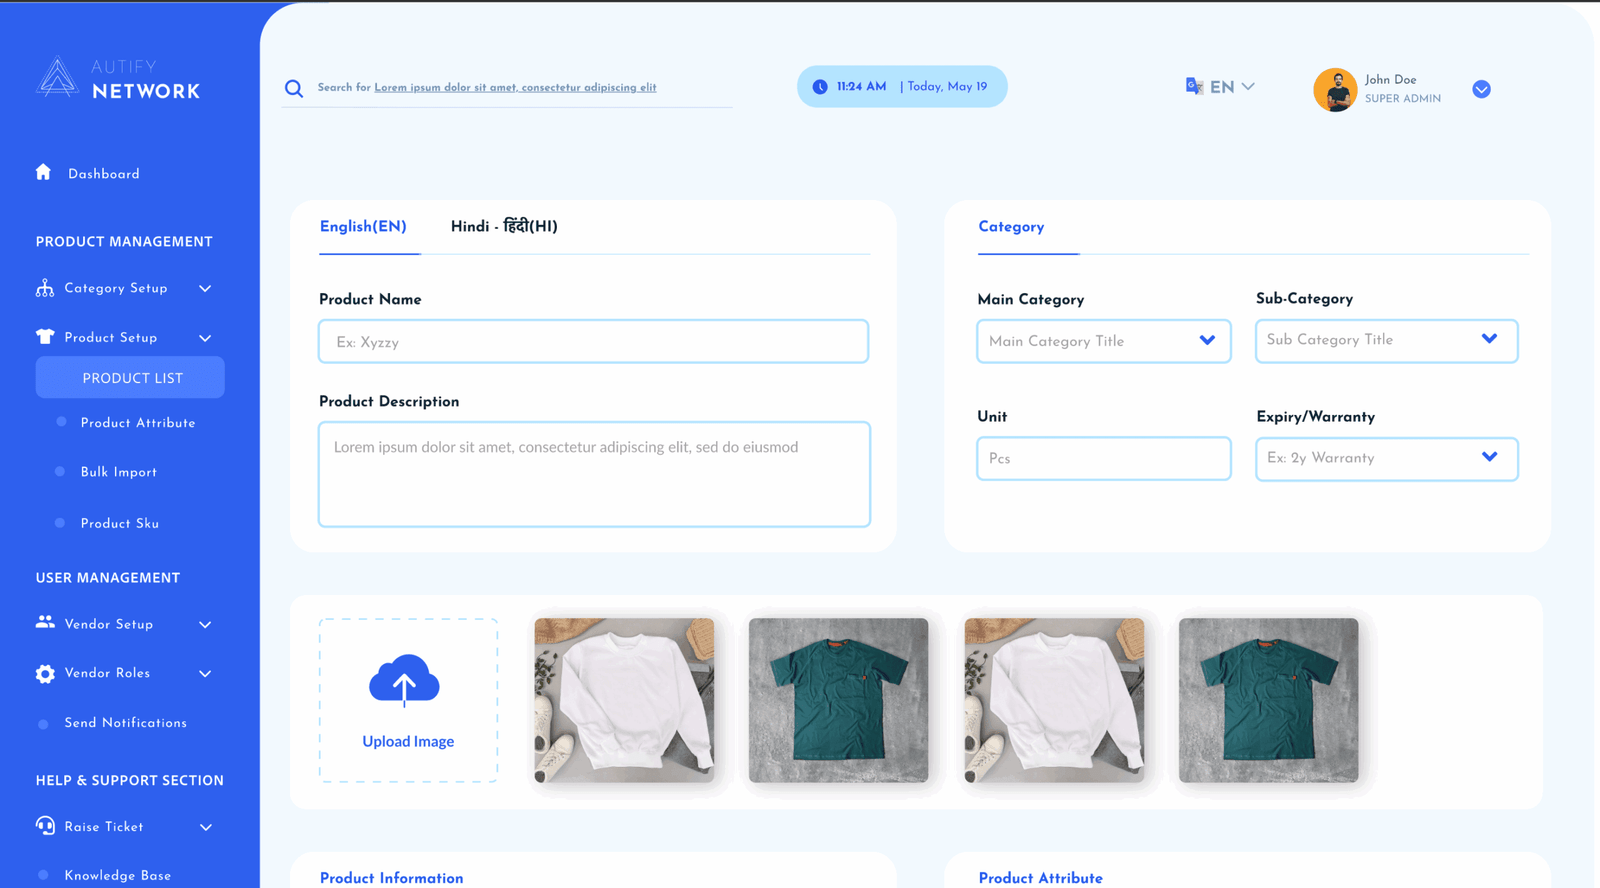
Product & Category ManagementUsers can quickly add and organize products into custom categories — making inventory and cataloging more structured and accessible. - Simple forms for product data entry
- Category tagging for better filtering and traceability
Vendor & Brand Owner Management
A dedicated section to add, view, and manage vendor relationships, complete with contact info, documents, and linked transactions.
Vendor profiles with quick PO access Brand-owner mapping for easy accountability
Billing & Purchase Orders
PO creation, billing summaries, and approvals — all in one place.No more digging through folders or sending follow-up emails.
Generate and download POs
View billing status at a glance
Track approvals and rejections with timestamps
Document Management
Every invoice, PO, and license — uploaded once, available anytime. Built-in cloud storage keeps everything organized and audit-ready.
Upload by vendor or category
Search and filter by document type
Expiry/reminder tags built in
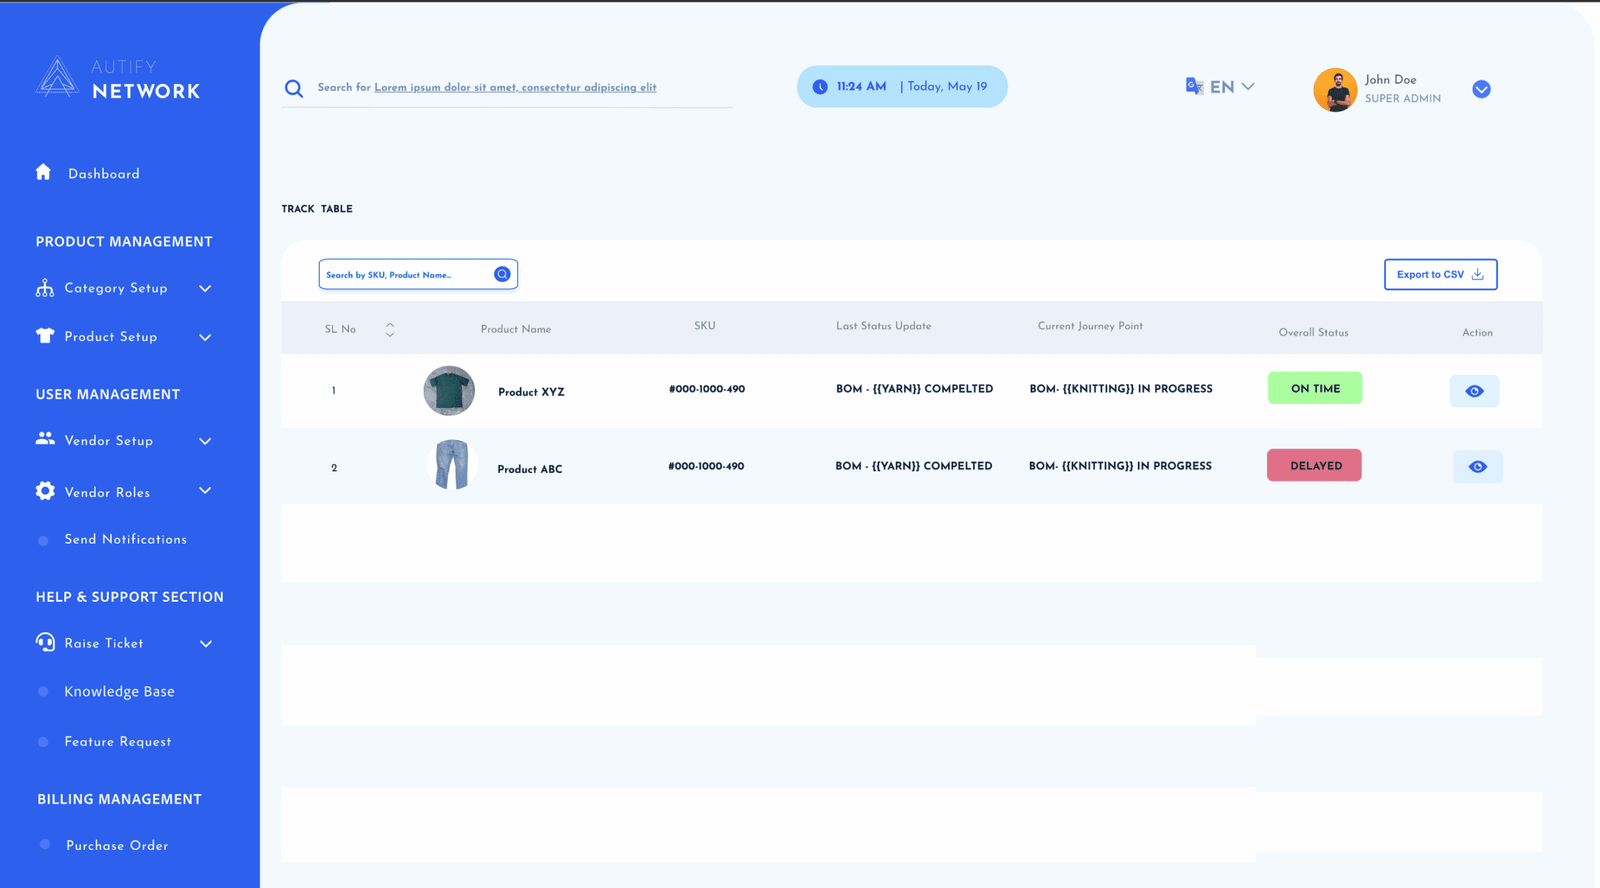
Track & Trace Dashboard
An activity feed and visual dashboard that brings day-to-day operations into real-time view.
View what's been ordered, shipped, or delayed
Detect bottlenecks instantly
Get notified of critical tasks and missing documents
05 / Design Decisions
-
Used a card-based layout to separate data clearly and improve scan-ability
-
Employed a neutral color palette with status-based highlights (green = good, red = issue, yellow = pending)
-
Created modular forms to reduce input friction and support future scaling
-
Prioritized mobile responsiveness for warehouse and on-field users
Final Thoughts
This dashboard turned supply chain confusion into real-time clarity.
By consolidating key operations into one intuitive interface, teams gained:
-
Faster vendor coordination
-
Accurate PO tracking
-
Easier document audits
-
Complete operational visibility — without the paperwork


